




Search
Related News
- 00
0000-00
How digital transformation improves aerospace fastener traceability - 00
0000-00
GE Aerospace Completes Key Open Fan Low-Pressure Turbine Tests in Poland - 00
0000-00
How creep limits high-temperature materials for advanced propulsion - 00
0000-00
Honeywell Joins Xiamen Aviation Park, Complementing Taikoo Landing Gear Repairs - 00
0000-00
How single-crystal casting expertise builds aerospace process moats
How aerospace materials analysis estimates component fatigue life




Material test data can support a credible fatigue-life estimate only when it represents the component’s material condition, local stresses, manufacturing history, and operating environment. A fatigue curve alone cannot establish how long an aircraft part will remain serviceable. The estimate must also define its endpoint: formation of a specified crack, growth to an inspection limit, or loss of required structural capability.
Aerospace materials engineering analysis connects laboratory evidence to these component-level decisions. Engineers combine cyclic material properties, stress analysis, service load histories, and fracture mechanics, then account for variability and validate the result through representative testing. The outcome is a life limit or inspection basis tied to explicit assumptions.
Define what “fatigue life” means before comparing predictions
Two reports can give different fatigue lives for the same component without contradicting each other. One may predict cycles to a small engineering crack; another may predict cycles until that crack reaches a limiting size. Comparing their headline numbers without checking the endpoint can lead to an unsafe interpretation.
Three concepts commonly shape the assessment:
- Crack initiation life: the period required to develop a crack of a defined size. The definition matters because laboratory detection methods and analytical models may use different thresholds.
- Crack propagation life: the period for an assumed or detected crack to grow from an initial size to a limiting condition.
- Total fatigue life: an assessment covering initiation and propagation, with a consistent boundary between the two to prevent overlap or omission.
The maintenance philosophy also changes the question. A safe-life assessment establishes a retirement limit using suitable evidence and allowances for variability. A damage-tolerance assessment evaluates how damage affects structural capability and whether inspections or other controls can manage its growth. Their applicability depends on the component, failure consequences, and governing airworthiness requirements.
Translate the operating mission into local material loading
An aircraft mission contains more than a count of flights. Pressurization, maneuver loads, landing events, engine starts, thermal transients, and vibration produce different stress histories. For an engine part, a relatively slow startup cycle may combine with rapid vibration cycles and sustained high-temperature exposure.
The analysis begins by translating these events into stresses and strains at likely fatigue locations. Holes, fillets, attachment features, cooling passages, and contact interfaces often deserve closer attention because geometry or load transfer concentrates the response.
Finite element analysis helps locate these regions, but a high stress contour is not sufficient evidence. Mesh sensitivity, boundary conditions, contact behavior, and thermal gradients must support the interpretation. If the local material yields during a cycle, a purely elastic stress result may be inadequate for estimating initiation life.
Mean stress matters as well as stress range. Cycles with the same range can produce different fatigue behavior when one remains predominantly tensile. Multiaxial loading adds another complication: when normal and shear stresses change direction or timing, a single equivalent stress may not represent the damaging cycle adequately.
Variable-amplitude histories are often reduced into cycle counts using methods such as rainflow counting. That makes complex loading manageable, but reduction must preserve the events that drive damage. For crack-growth analysis, load sequence can be important because overloads and changes in crack closure can alter subsequent growth.
Choose the fatigue method around the failure mechanism
Stress–life, strain–life, and fracture-mechanics methods answer related but different questions. Their usefulness depends on the expected material response and the damage state being assessed.
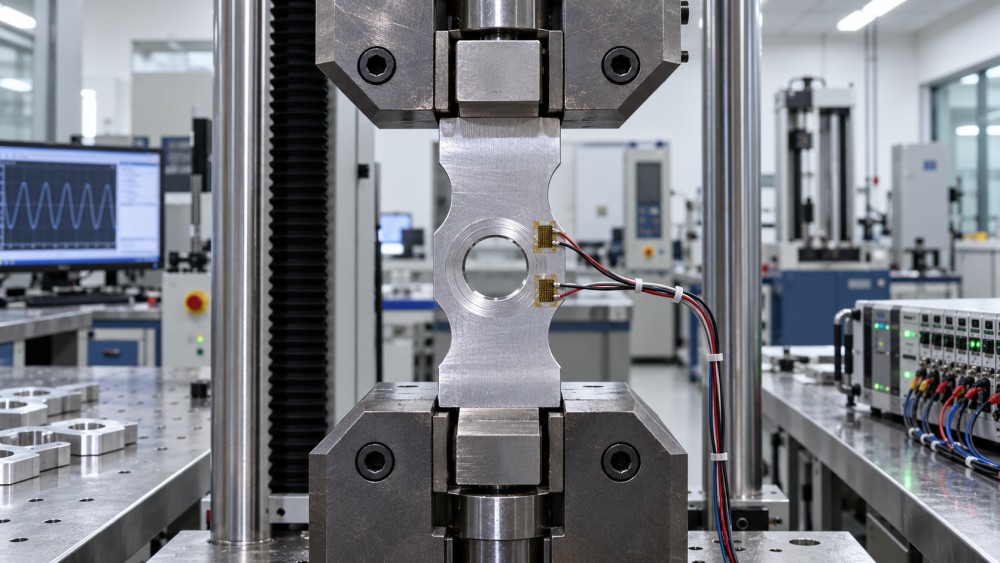
In stress–life analysis, test results relate cyclic stress to the number of cycles reaching a defined failure endpoint. Surface finish, mean stress, and other differences between test specimens and the component must be addressed. A fatigue-strength plateau should not be assumed across all aerospace alloys and service environments.
Strain–life analysis separates elastic and plastic contributions to cyclic deformation. It is useful when a notch experiences local plastic strain even though most of the component remains elastic. The calculation needs cyclic stress–strain behavior; monotonic tensile properties alone do not describe how a material hardens or softens under repeated loading.
Crack-growth analysis starts with a flaw and predicts its progression. For metallic components under conditions where linear-elastic fracture mechanics applies, the stress-intensity-factor range describes the cyclic crack-driving force. Growth data must match relevant conditions, including stress ratio, temperature, and environment. Small cracks can behave differently from the longer cracks used to generate conventional growth curves.
These methods cannot be added together indiscriminately. If specimen life already includes substantial crack propagation, adding a separate propagation estimate may count part of the life twice.
Material and manufacturing condition determine whether test data transfer
A matching alloy designation is only the starting point. Product form, heat treatment, grain structure, orientation, and manufacturing route can change fatigue behavior. Data from a wrought bar may not represent a casting, forging, welded region, or additively manufactured part made from a nominally similar alloy.
Microstructure influences where cracks begin and how they advance. In titanium forgings, local microtexture and loading orientation can affect fatigue response. In nickel-based engine alloys, temperature, grain structure, and dwell exposure can change the balance between cyclic damage and time-dependent mechanisms.
Manufacturing features often control the earliest damage. Inclusions, pores, machining marks, recast layers, and unfavorable residual stresses can create initiation sites. Their influence depends on location and orientation: a defect near a highly stressed surface may be more damaging than a larger defect in a lightly loaded region.
Surface treatments require the same discipline. Shot peening may improve fatigue resistance by introducing compressive residual stress, but the benefit depends on process control and stability during service. Temperature or subsequent processing can change the residual-stress field. Coatings can alter surface condition, environmental protection, and local cracking behavior, so their effect should be supported by relevant evidence.
This is why supplier assessment should connect fatigue data to the delivered manufacturing route. Traceable heat treatment, controlled machining, surface inspection, and defect acceptance criteria help establish whether the tested material represents production hardware. Process accreditation can support confidence in process control; it does not independently establish component fatigue life.
Account for temperature, dwell, contact, and composites explicitly
Room-temperature fatigue data can be a poor basis for a hot-section component. Elevated temperature changes material properties and may introduce oxidation, creep, and interactions between damage mechanisms. A tensile hold period can affect life even when the nominal cycle count remains unchanged.
Thermomechanical fatigue adds the relationship between temperature and mechanical strain. Heating and cooling can produce different damage depending on when tensile strain occurs during the temperature cycle. An isothermal test at one temperature may therefore miss the governing mechanism.
Contact regions introduce fretting fatigue. Small relative movements at an attachment or joint can damage the surface and promote cracking, even when nominal stresses appear acceptable. The relevant assessment must address contact pressure, slip, friction, and local geometry.
Carbon fiber composites need a different interpretation from metallic parts. Fatigue can involve matrix cracking, delamination, fiber damage, and changes in stiffness or residual strength. Layup, load direction, joints, impact damage, and environmental conditioning matter. A metallic crack-growth model cannot simply be transferred to a laminate; testing must represent its architecture and likely damage modes.
Turn calculated life into a defensible limit or inspection interval
Fatigue results scatter because nominally similar specimens contain different initiation sites and microstructural features. A best-fit curve describes central behavior but does not automatically provide a suitable design basis. The assessment needs an appropriate treatment of variability, data coverage, and confidence for its intended use.
Variable-amplitude initiation calculations often use cumulative damage rules. A common approach sums the fractions of life consumed at different load levels. This is useful for organizing complex spectra, but it simplifies sequence effects and interactions. A calculated damage sum is meaningful only within a method supported by relevant evidence.
For inspection planning, the starting crack size deserves particular scrutiny. It may be based on manufacturing assumptions, an accepted damage scenario, or inspection capability. Nominal instrument resolution is insufficient: reliable detection depends on flaw orientation, access, material, geometry, procedure, and inspection conditions.
The analysis then evaluates growth toward a limiting condition established through residual-strength or fracture assessment. Inspection scheduling must account for reliable detectability, growth uncertainty, and the applicable maintenance approach. An interval does not follow automatically from dividing calculated propagation life by an arbitrary factor.
A single conservative assumption cannot compensate for missing physics. Assuming a larger initial flaw, for example, may not address an omitted corrosion mechanism or an unrepresentative load spectrum.
What makes a fatigue-life assessment reviewable?
A useful report makes the chain from input data to engineering decision visible. The central question is whether another qualified reviewer can understand why the model applies, reproduce its logic, and identify the conditions that would invalidate the result.
- A defined endpoint: the crack size, damage state, or structural condition represented by the reported life.
- Representative inputs: material pedigree, manufacturing condition, surface state, temperature, environment, and load spectrum.
- A justified model: evidence that the selected method captures local cyclic response and the governing failure mechanism.
- A stated uncertainty treatment: how scatter, load variability, defect assumptions, and model limitations influence the decision.
- Validation at suitable scale: comparison with relevant specimen, feature, subcomponent, or component tests, including agreement in failure location and mechanism.
Testing a feature such as a bolted joint or cooling-hole geometry can expose effects absent from smooth coupons. Component testing can reveal load redistribution and interactions, although it still needs an analytical basis to interpret differences from service conditions. Fractography provides another check: if observed cracks start at a different location or through a different mechanism, matching the final cycle count alone offers limited validation.
Before accepting a life estimate, establish which inputs control it most strongly. Sensitivity studies can show whether better surface characterization, a revised mission spectrum, improved defect detection, or additional elevated-temperature data would materially change the decision. That directs further work toward the evidence that matters—and makes clear when a manufacturing change, repair, or new operating mission requires reassessment.
Related News
- How aerospace materials analysis estimates component fatigue lifeOct 25, 2026Explore how aerospace materials engineering analysis combines fatigue testing, service loads, and crack-growth models to estimate component life and guide inspection planning.
- How to define fatigue load spectra for aircraft component testingOct 24, 2026Improve aircraft component testing with fatigue load spectra that reflect real service conditions. Learn how to preserve load sequences, validate severity, and avoid misleading results.
- How to assess fatigue life in lightweight aircraft structural componentsOct 19, 2026Assess fatigue life in lightweight aircraft structural components using load spectra, damage tolerance, and testing. Discover practical steps to build a defensible life assessment.
- How train nose design reduces aerodynamic pressure waves in tunnelsOct 12, 2026Aerodynamic pressure wave trains are reduced by optimized nose geometry. Discover how tapered profiles, area growth, and tunnel design improve comfort and control pressure waves.